It is a known fact that the House Crow (Corvus splendens), also called the Indian House Crow, is a serious threat to native birds in Kenya. Being an introduced invasive species from Asia, it is outcompeting several native Kenyan birds and displacing them from nesting and feeding areas. It is still largely confined to the coast but is spreading inland rapidly.

33229)
A program to eradicate or at least control this menace before it gets out of hand has been proposed and may begin very soon. One key component of assessing the impact of this program is to monitor the distribution and relative abundance of the crow over time as the program is implemented. It’s important that we document the House Crow’s status before and after the program begins to get a reliable picture of how successful (or not) the program has been and to provide insights on appropriate courses of action moving forward.
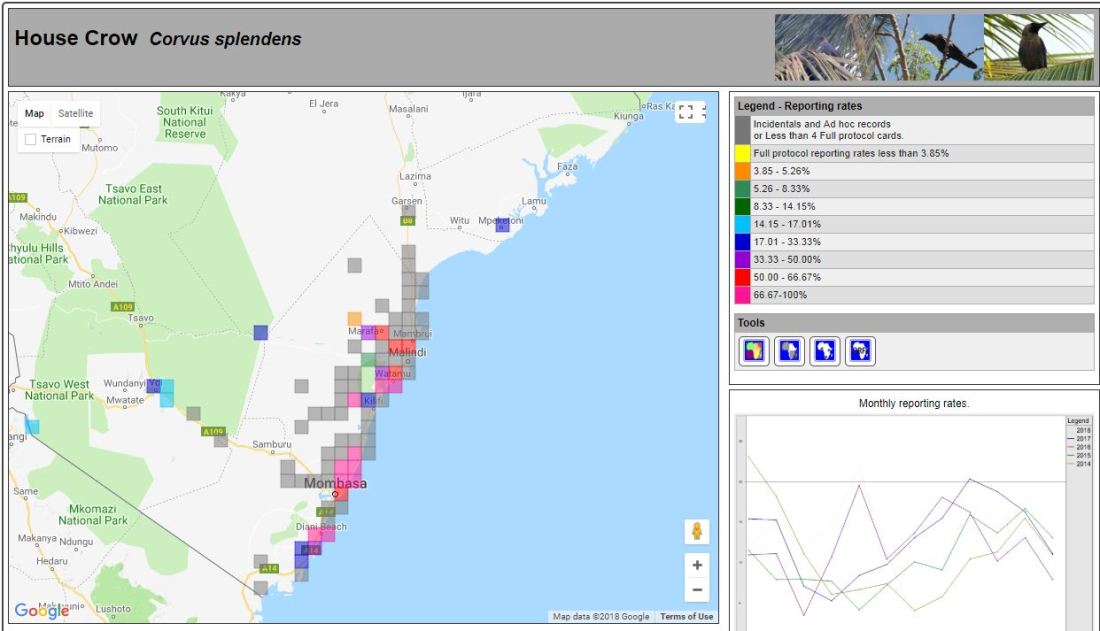
The Kenya Bird Map project is a perfect tool for this job. The project’s atlas data produce a map that reflects both the distribution and reporting rates (hence relative abundance) of all bird species in Kenya. This can be used to monitor the status of the House Crow over time as well as to see how well the local bird species are doing as the eradication program is implemented.
At the moment, most of the pentads at the coast have less than 3 Full Protocol cards (bird lists) submitted for them, hence they are yellow or orange on the Coverage Map (see the map below). The minimum number of FP cards required in order for some reliable data analysis to be done for a pentad is 4 (green color on the map). Birders at the coast need to do their best to turn as many of the coastal pentads green (4 cards) before the House Crow eradication program begins, so that we can compare the before and after scenarios of the House Crow eradication program!

For any birders at the coast, please do your best to turn as many of the coastal pentads green (or any other color above 4 Full Protocol cards) as possible! You can use the Coverage Map on the KBM website to see which ones are still yellow or orange and visit them to turn them green!
If you are an avid birder and are not yet registered on the Kenya Bird Map project, simply send an email with your name, preferred email address and phone number to kenyabirdmap@naturekenya.org to get registered and contribute to this very important conservation project.
P.S. Remember, all you need to do to achieve a Full Protocol card is to actively search for and record birds within a pentad for a minimum of 2 hours. You have 5 days to achieve the 2 hours (e.g. it can be 30 minutes today, 1 hour tomorrow, 10 minutes the following day, 10 minutes on the fourth day and 10 minutes on the fifth day). Make sure to record the birds in the order that you see them and to submit the list to the KBM once done. The BirdLasser mobile app makes it very easy to do this and is available for free on the app store for Androids and iOS phones. Feel free to contact kenyabirdmap@naturekenya.org if you have any questions about bird mapping/atlassing.
For more on how the Kenya Bird Map is contributing to House Crow erradication efforts along the coast, please watch the following video presentation by Dr. Colin Jackson:
